stats.h File Reference
Statistics. More...
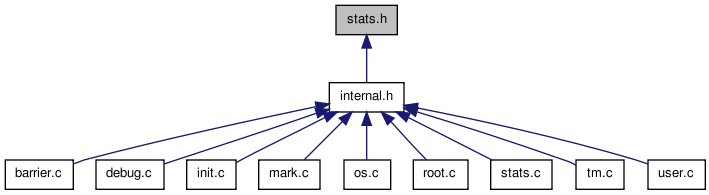
Go to the source code of this file.
Data Structures | |
| struct | tm_time_stat |
| Timing statstics. More... | |
Functions | |
| void | tm_time_stat_begin (tm_time_stat *ts) |
| Begin timing stats collection. | |
| void | tm_time_stat_end (tm_time_stat *ts) |
| End timing stats collection. | |
| void | tm_print_stats () |
| API: Print statistics. | |
| void | tm_print_block_stats () |
| API: Print block statistics. | |
| void | tm_print_time_stats () |
| API: Print timing stats. | |
Detailed Description
Statistics.
Definition in file stats.h.
Function Documentation
| void tm_print_block_stats | ( | ) |
API: Print block statistics.
Definition at line 208 of file stats.c.
00209 {
00210   tm_type *t;
00211
00212   tm_block *b;
00213
00214   tm_msg_enable("X", 1);
00215
00216   tm_msg("X { b tb%lu[%lu] block_id %d\n",
00217          tm.n[tm_B],
00218          tm.n[tm_B] * tm_block_SIZE,
00219          tm.block_id
00220          );
00221
00222   tm_list_LOOP(&tm.types, t);
00223   {
00224     tm_msg("X   t#%d @%p s%lu \n", t->id, (void*) t, (unsigned long) t->size);
00225
00226     tm_list_LOOP(&t->blocks, b);
00227     {
00228       int j;
00229
00230       _tm_block_validate(b);
00231
00232       tm_msg("X     b#%d @%p s%lu ", (int) b->id, (void*) b, (unsigned long) b->size);
00233
00234       for ( j = 0; j < sizeof(b->n)/sizeof(b->n[0]); j ++ ) {
00235         tm_msg1("%c%-4lu ", tm_color_name[j][0], (unsigned long) b->n[j]);
00236       }
00237
00238       /* Parcel utilization. */
00239       tm_msg1("T/b%3d%% ",
00240               (int) ((b->n[tm_TOTAL] * 100) / b->n[tm_CAPACITY])
00241         );
00242
00243       /* Compute block utilization. */
00244       tm_msg1("(T-W)/b%3d%% ",
00245               (int) (((b->n[tm_TOTAL] - b->n[tm_WHITE]) * 100) / b->n[tm_CAPACITY])
00246               );
00247
00248       tm_msg1("\n");
00249     }
00250     tm_list_LOOP_END;
00251   }
00252   tm_list_LOOP_END;
00253
00254   tm_msg("X }\n");
00255
00256   tm_msg_enable("X", 0);
00257 }
| void tm_print_stats | ( | ) |
API: Print statistics.
Definition at line 93 of file stats.c.
00094 {
00095   tm_type *t;
00096   size_t sum[tm__LAST3];
00097
00098   memset(sum, 0, sizeof(sum));
00099
00100   tm_msg_enable("X", 1);
00101
00102   tm_msg("X { t#%d : blk_in_use %lu[~%lu], blk_free %lu[~%lu]\n",
00103          tm.type_id,
00104          tm.n[tm_B],
00105          tm.n[tm_B] * tm_block_SIZE,
00106          tm.free_blocks_n,
00107          tm.free_blocks_n * tm_block_SIZE
00108          );
00109
00110   tm_list_LOOP(&tm.types, t);
00111   {
00112     tm_msg("X  t#%d S%-6lu\n", t->id, (unsigned long) t->size, (unsigned) t->n[tm_B]);
00113     _tm_print_utilization("X    ", t, t->n, sizeof(t->n)/sizeof(t->n[0]), sum);
00114   }
00115   tm_list_LOOP_END;
00116
00117   /* current/max number of blocks/bytes allocated from OS is in tm.n[]. */
00118   sum[tm_B_OS] = tm.n[tm_B_OS];
00119   sum[tm_b_OS] = tm.n[tm_b_OS];
00120   sum[tm_B_OS_M] = tm.n[tm_B_OS_M];
00121   sum[tm_b_OS_M] = tm.n[tm_b_OS_M];
00122
00123   _tm_print_utilization("X  S ", 0, sum, sizeof(sum)/sizeof(sum[0]), sum);
00124
00125   tm_msg("X }\n");
00126
00127   tm_msg_enable("X", 0);
00128
00129   tm_print_time_stats();
00130
00131   tm_print_color_transition_stats();
00132
00133   tm_print_phase_transition_stats();
00134
00135   //tm_validate_lists();
00136 }
| void tm_print_time_stats | ( | ) |
API: Print timing stats.
Definition at line 395 of file stats.c.
00396 {
00397   int i;
00398
00399   tm_msg_enable("T", 1);
00400
00401   tm_msg("T {\n");
00402
00403   tm_time_stat_print_(&tm.ts_os_alloc, ~0, 0);
00404   tm_time_stat_print_(&tm.ts_os_free, ~0, 0);
00405   tm_time_stat_print_(&tm.ts_alloc, ~0, 0);
00406   tm_time_stat_print_(&tm.ts_free, ~0, 0);
00407   tm_time_stat_print_(&tm.ts_gc, ~0, 0);
00408   tm_time_stat_print_(&tm.ts_barrier, ~0, 0);
00409   tm_time_stat_print_(&tm.ts_barrier_pure, ~0, 0);
00410   tm_time_stat_print_(&tm.ts_barrier_root, ~0, 0);
00411   tm_time_stat_print_(&tm.ts_barrier_black, ~0, 0);
00412
00413   for ( i = 0;
00414         i < (sizeof(tm.ts_phase) / sizeof(tm.ts_phase[0]));
00415         ++ i ) {
00416     tm_time_stat_print_(&tm.ts_phase[i], ~0, &tm.alloc_by_phase[i]);
00417   }
00418
00419   tm_msg("T }\n");
00420
00421   tm_msg_enable("T", 0);
00422 }
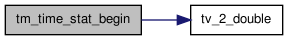
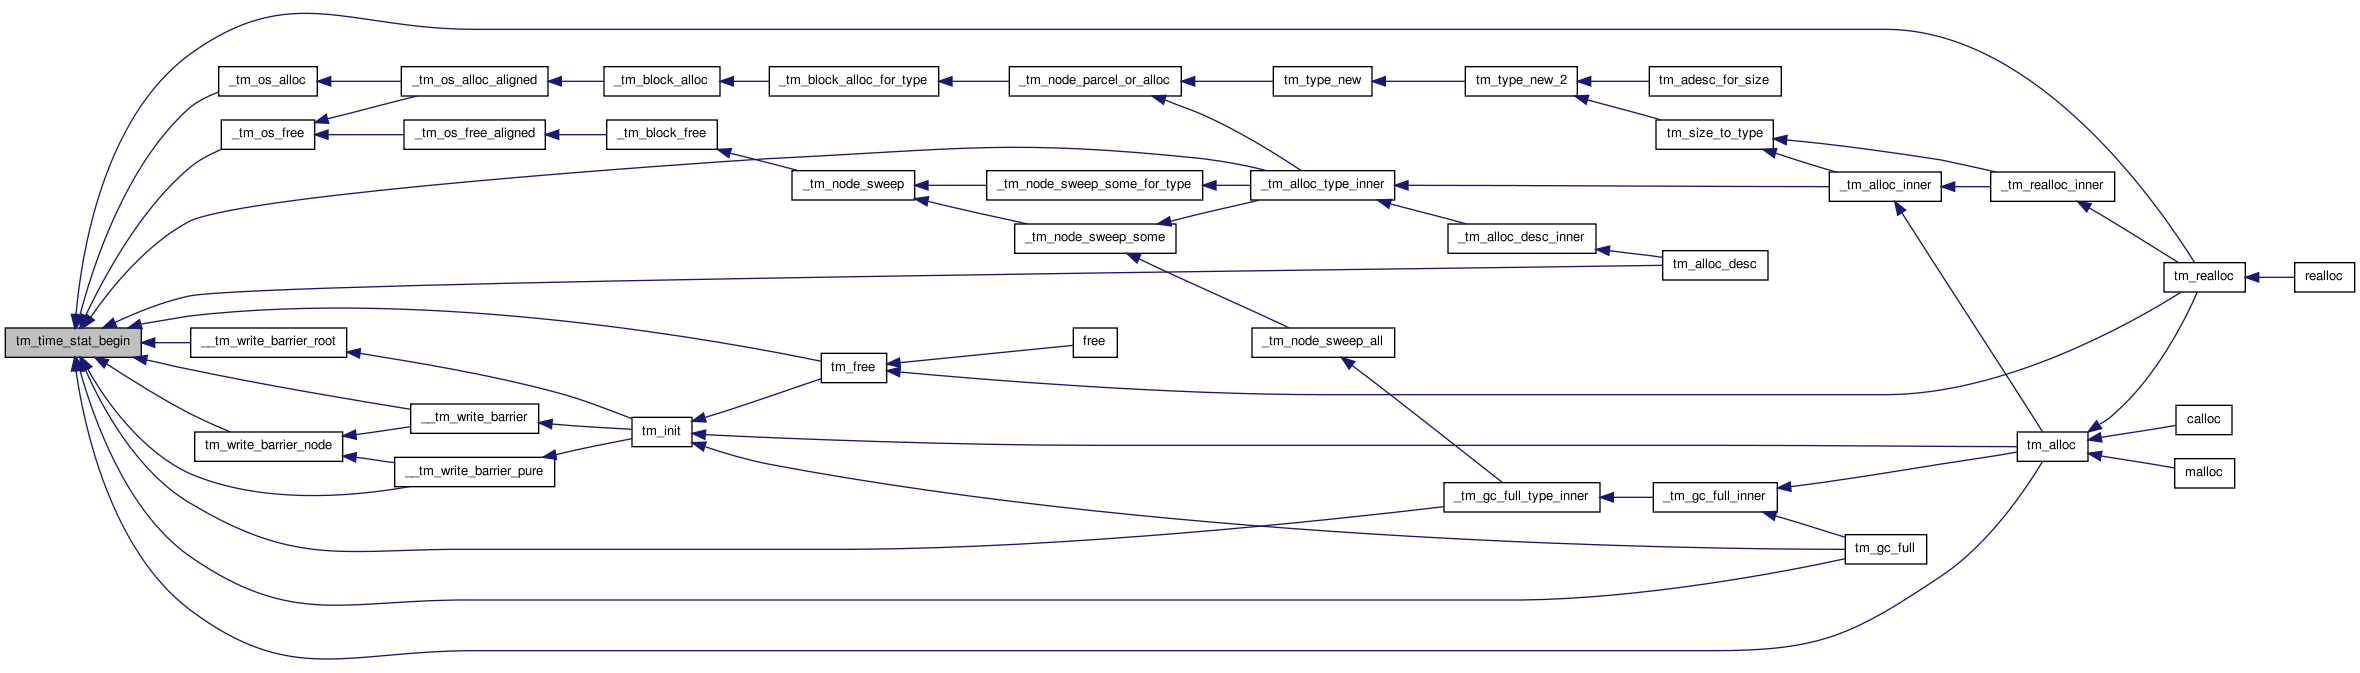
| void tm_time_stat_begin | ( | tm_time_stat * | ts | ) |
Begin timing stats collection.
Definition at line 269 of file stats.c.
References tm_time_stat::t0, tm_time_stat::t01, and tv_2_double().
Referenced by __tm_write_barrier(), __tm_write_barrier_pure(), __tm_write_barrier_root(), _tm_alloc_type_inner(), _tm_gc_full_type_inner(), _tm_os_alloc(), _tm_os_free(), tm_alloc(), tm_alloc_desc(), tm_free(), tm_gc_full(), tm_realloc(), and tm_write_barrier_node().
00270 {
00271 #if tm_USE_times
00272   struct tms t0;
00273   times(&t0);
00274   ts->t0 = (double) t0.tms_utime / (double) CLOCKS_PER_SEC;
00275   ts->t01 = (double) t0.tms_stime / (double) CLOCKS_PER_SEC;
00276 #else
00277   struct timeval t0;
00278   gettimeofday(&t0, 0);
00279   ts->t0 = tv_2_double(&t0);
00280 #endif
00281 }
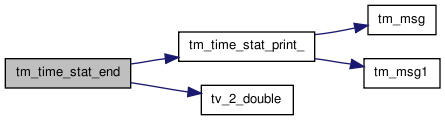
| void tm_time_stat_end | ( | tm_time_stat * | ts | ) |
End timing stats collection.
Definition at line 287 of file stats.c.
References tm_time_stat::count, tm_time_stat::t0, tm_time_stat::t01, tm_time_stat::t1, tm_time_stat::t11, tm_time_stat::ta, tm_time_stat::td, tm_time_stat_print_(), tm_time_stat::ts, tv_2_double(), tm_time_stat::tw, and tm_time_stat::tw_changed.
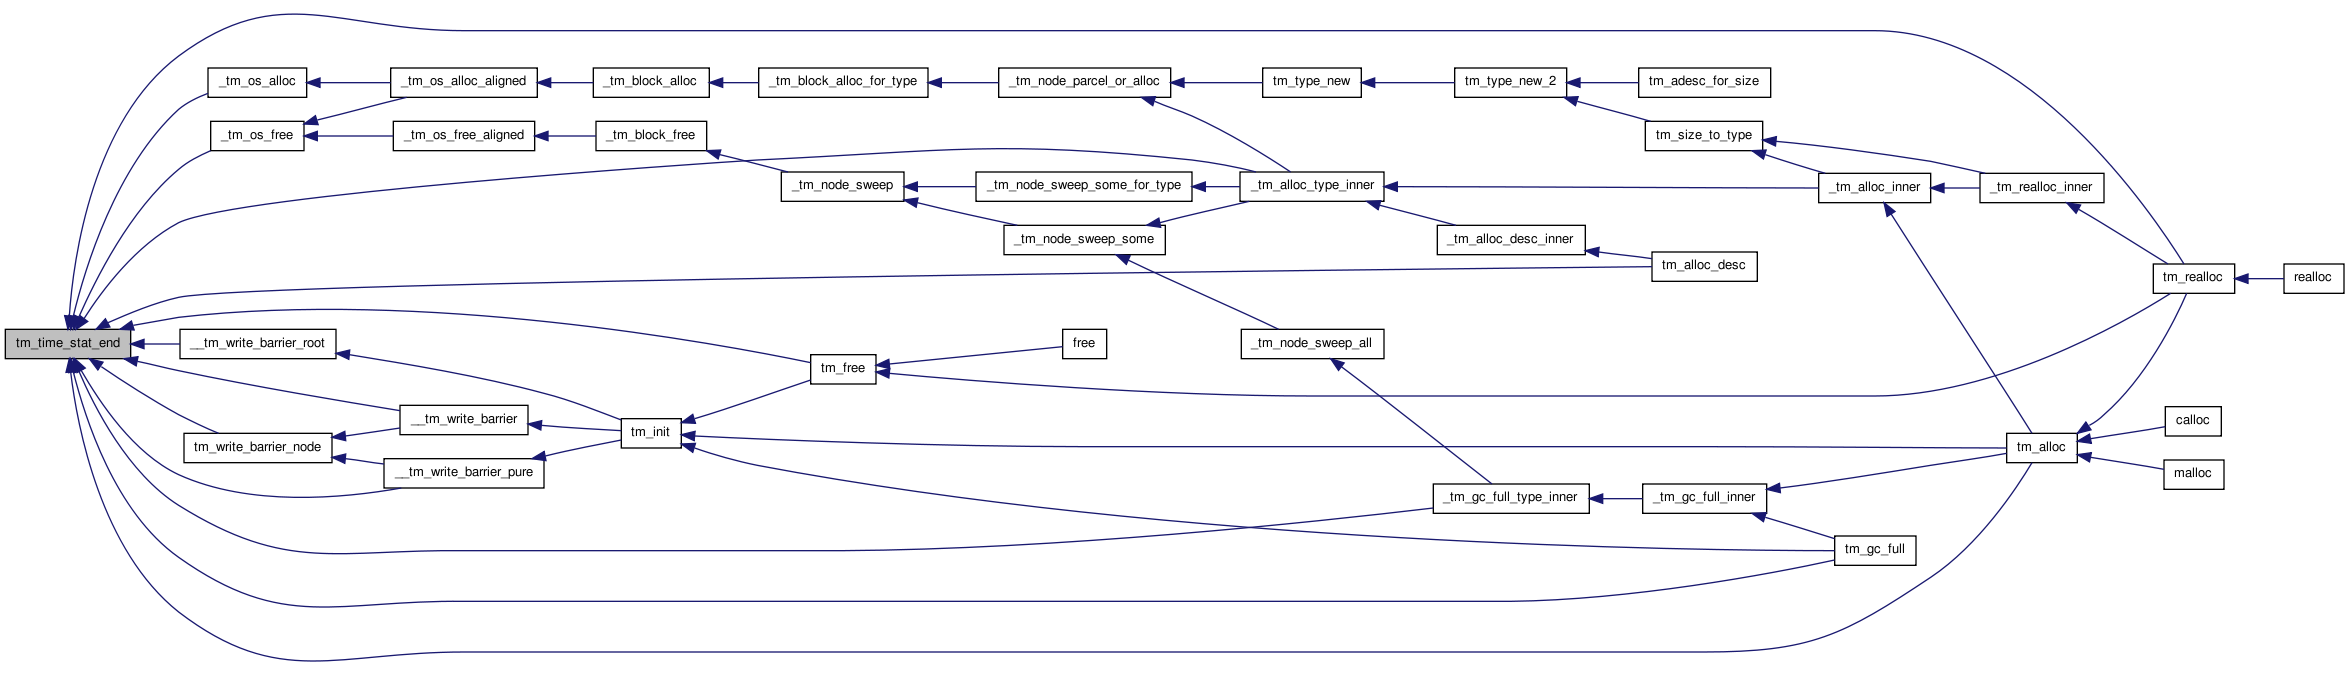
Referenced by __tm_write_barrier(), __tm_write_barrier_pure(), __tm_write_barrier_root(), _tm_alloc_type_inner(), _tm_gc_full_type_inner(), _tm_os_alloc(), _tm_os_free(), tm_alloc(), tm_alloc_desc(), tm_free(), tm_gc_full(), tm_realloc(), and tm_write_barrier_node().
00288 {
00289 #if tm_USE_times
00290   {
00291     struct tms t1;
00292     times(&t1);
00293     ts->t1 = (double) t1.tms_utime / (double) CLOCKS_PER_SEC;
00294     ts->t11 = (double) t1.tms_stime / (double) CLOCKS_PER_SEC;
00295   }
00296 #else
00297   {
00298     struct timeval t1;
00299     gettimeofday(&t1, 0);
00300     ts->t1 = tv_2_double(&t1);
00301   }
00302 #endif
00303
00304   ++ ts->count;
00305
00306   /* Compute dt. */
00307   ts->td = ts->t1 - ts->t0;
00308 #if tm_USE_times
00309   ts->td += ts->t11 - ts->t01;
00310 #endif
00311
00312   /* Compute sum of dt. */
00313   ts->ts += ts->td;
00314
00315   /* Compute avg time. */
00316   ts->ta = ts->ts / (double) ts->count;
00317
00318   /* Compute worst time. */
00319   if ( (ts->tw_changed = ts->tw < ts->td) ) {
00320     ts->tw = ts->td;
00321   }
00322
00323 #if 0
00324   /* Print stats. */
00325   tm_time_stat_print_(ts, ts->tw_changed ? 1 : 0, 0);
00326 #endif
00327 }